COVID-19 Survey Results: Impacts are vast, amidst signs of resiliency

In order to assess immediate economic impacts and understand the evolving business sentiment, we have deployed a survey with our partners at San Diego Regional Chamber of Commerce, San Diego and Imperial Small Business Development Center. The Downtown San Diego Partnership and National City Chamber of Commerce also served as survey partners. The survey will remain open for the foreseeable future so we can chart how responses change over time.

Three trends stood out based on what employers told us during the first three weeks of surveying:

  1. Impacts are vast. 379 employers plan to eliminate 14,524 jobs; 68% of their combined workforce.
  1. Small businesses are embracing remote work. More than 85% of firms with remote workers are small businesses. Overall, 42% of employers surveyed are having employees work remotely.
  1. Firms are still hiring. More than 11% of firms are still planning to fill positions. Nearly 19% of those firms still hiring are in the professional service industry.

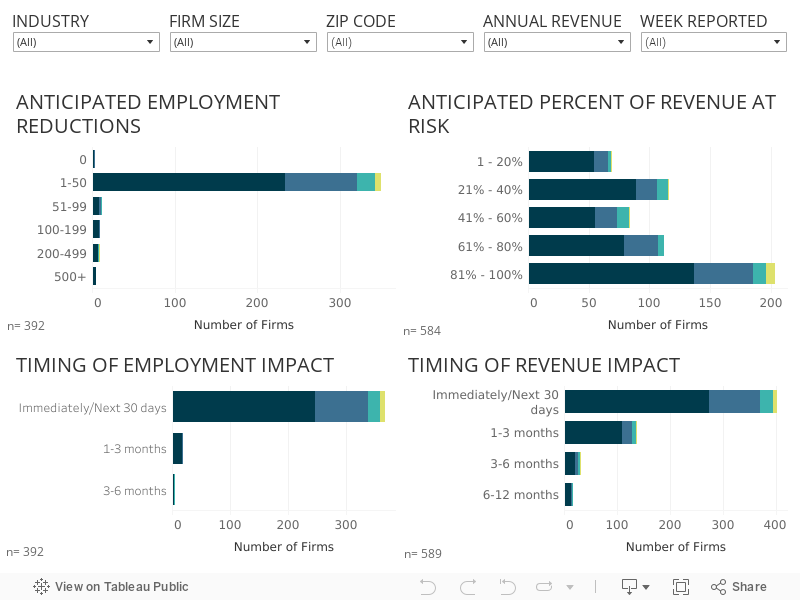
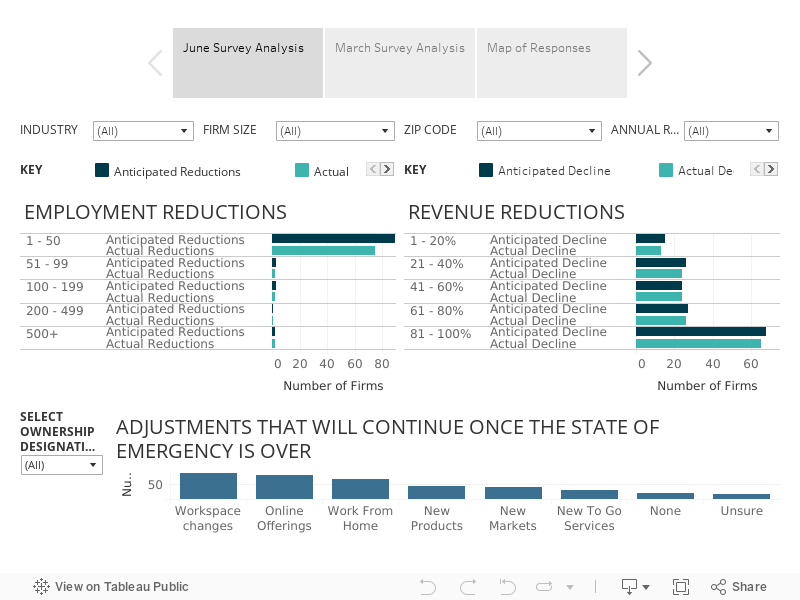
Understanding COVID-19’s impact: an interactive visualization

Below is an interactive visualization of self-reported impacts to local employers, both in terms of employment and revenue. You can segment the data by industry, number of employees, and typical annual revenue. Additionally, please scroll over the tab to look at the breakdown of responses via zipcode. Please note, this is not a representative sample – meaning we did not weight responses operationally to the population and demographics of the region – so we strongly advise against drawing sub-regional conclusions from this data.

Respondent Profile

For up-to-date respondent information on the survey respondents and high level results, please view the responding profile here.
Other key numbers:

      • Number of responses: 681

Covid-19 Survey Results_San Diego_ April 8

Resources for you

San Diego Regional EDC, San Diego Regional Chamber of Commerce, and San Diego and Imperial SBDC offer a variety of resources to help businesses.

If you would like assistance from EDC, please use this form. Once we receive your responses, we will make every effort to reach out to you within 24 hours.

Request EDC assistance

COVID-19 Survey Results: Immediate impacts are concentrated, severe, and hit small business & low wage workers hardest

More than 86% of businesses in San Diego expect to see revenue losses in the wake of COVID-19, according to an economic impact survey on the San Diego economy.

In order to assess immediate economic impacts and understand the evolving business sentiment, we have deployed a survey with our partners at San Diego Regional Chamber of Commerce and Imperial Small Business Development Center. The Downtown San Diego Partnership and National City Chamber of Commerce also served as survey partners. The survey will remain open for the foreseeable future so we can chart how responses change over time.

Key Takeaways

Three trends stood out based on what employers told us during the first two weeks of surveying:

  1. Impacts are concentrated by industry. Of the 360 employers planning to reduce staff, 80% are in the food and beverage or tourism industries.
  1. Impacts are immediate. Nearly 94% of employers anticipating staffing reductions and two-thirds of those expecting revenue declines expect those hits within 30 days.
  1. Impacts disproportionately affect small businesses. Employers with annual revenues below $1M anticipate average losses in income of nearly 70%, compared with an average loss of 51% for businesses earning more than $1M annually.

A majority of employers (61%) are in need of capital support. More than half of those with capital needs are the smallest of employers with fewer than 5 employees.

AN Interactive Visualization

Below is an interactive visualization of self-reported impacts to local employers, both in terms of employment and revenue. You can segment the data by industry, number of employees, and typical annual revenue

Small businesses are the backbone of our local economy and the majority of the Chamber’s membership. They account for 98 percent of businesses in the region. Our focus now more than ever is on those small businesses. We are working with local and federal officials to ensure our region’s businesses have what they need to weather this storm. We are focused on resiliency and recovery.

Jerry Sanders, president & CEO, San Diego Regional Chamber of Commerce

Respondent Profile

For up-to-date respondent information on the survey respondents and high level results, please view the responding profile here.
Other key numbers:

  • Number of responses: 642
  • Number of responses in this analysis: 642

While the impacts of COVID-19 are rippling through the entire region, the survey shows that small businesses – which are responsible for a majority of our economic growth – are disproportionately impacted. It’s a long road to recovery, and I want to remind you that EDC’s staff is here to help you access loans and grants, and work one-on-one to triage issues as they arise.

Mark Cafferty, president & CEO, San Diego Regional EDC

Resources for you

San Diego Regional EDC, San Diego Regional Chamber of Commerce, and San Diego and Imperial SBDC offer a variety of resources to help businesses.

If you would like assistance from EDC, please use this form. Once we receive your responses, we will make every effort to reach out to you within 24 hours.

Request EDC assistance

If you are looking for general information about COVID-19, please view this page.

All of us at the San Diego & Imperial SBDC Network know this public health crisis is hitting you, the small business owner, very hard. Know we are here to help. We are still providing all our services, just online. You can still visit SDIVSBDC.org and click “request counseling” to get assistance. We are here to help you apply for capital and work through the ways you now have to pivot to get through this time where we all have to be physically distant from one another.

Danny Fitzgerald, San Diego and Imperial Small Business Development Center


*industries include retail trade (excluding groceries and gas stations), wholesale trade, arts & entertainment, accommodation & food services.

San Diego’s Economic Pulse: February 2020

Each month the California Employment Development Department (EDD) releases employment data for the prior month. Each year, the Labor Market Information Division (LMID), in cooperation with the federal Bureau of Labor Statistics (BLS), revises historical industry employment, labor force, and hours and earnings estimates. The revision process, also called “benchmarking,” produces updates to the data sets used to generate the monthly estimates.

This edition of San Diego’s Economic Pulse covers 2019 benchmarking updates and data from January 2020. Check out EDC’s research bureau for more data and stats about San Diego’s economy.

Highlights include:

  • The region’s unemployment rate was 3.3 percent in January 2020, up from a revised 2.8 percent in December 2019, and below the year-ago estimate of 3.8 percent
  • The region’s unemployment rate remains lower than both the state and national unemployment rates of 4.3 percent and 4.0 percent, respectively
  • Between December 2019 and January 2020, total nonfarm employment decreased from 1,525,200 to 1,501,700, losing 23,500 jobs
  • Between January 2019 and January 2020, total nonfarm employment increased from 1,482,000 to 1,501,700, adding 19,700 jobs
  • Professional and business services led the year-over-year gain, adding 8,600 jobs
  • Benchmark revisions show that the region experienced slower employment growth in 2019, ending the year with 15,500 fewer jobs than originally estimated

San Diego’s Quarterly Economic Snapshot: Q4 2019

Summary

Every quarter, San Diego Regional EDC analyzes key economic indicators that are important to understanding the regional economy and the region’s standing relative to the 25 most populous metropolitan areas in the U.S. This issue covers data from Q4 2019.

As 2019 wraps up and the region continues to struggle with housing affordability, the number of annual building permits continues to decrease. In 2019, there were 8,082 building permits issued, with 3,023 single family permits and 5,059 multi-family permits. Annual building permits saw a 17.4 percent decrease from 2018 to 2019. Building permits have decreased annually since 2016.

Key findings from the snapshot:

  • San Diego’s unemployment rate continues to drop, at 2.8 percent in Q4
  • Total annual nonfarm employment increased by 34,800 jobs, or 2.3 percent from Q4 2018 to Q4 2019, led by 9,500 new jobs in the Professional and Business Services industry
  • The Trade, Transportation, and Utilities recorded the largest quarterly gain, adding 10,800 jobs, or 4.9 percent compared to Q3 2019
  • San Diego’s housing market was the second most expensive in the nation with the median home price at $655,000 in Q4, up annually by 4.6 percent
  • While annual building permits issued for 2019 were lower than 2018, Q4 2019 housing permits were greater than Q4 2018
  • San Diego saw 39 Venture Capital deals worth $655 million, primarily concentrated in the healthcare sector

READ THE FULL REPORT

San Diego’s Economic Pulse: January 2020

Each month the California Employment Development Department (EDD) releases employment data for the prior month. This edition of San Diego’s Economic Pulse covers December 2019. Check out EDC’s research bureau for more data and stats about San Diego’s economy.

Highlights include:

  • The region’s unemployment rate was 2.8 percent in December 2019, down from a revised 2.9 percent in November 2019, and below the year-ago estimate of 3.1 percent
  • The region’s unemployment rate remains lower than both the state and national unemployment rates of 3.7 percent and 3.4 percent, respectively
  • Between November 2019 and December 2019, total nonfarm employment increased from 1,538,200 to 1,540,700, adding 2,500 jobs
  • Between December 2018 and December 2019, total nonfarm employment increased from 1,505,900 to 1,540,700, adding 34,800 jobs
  • Between December 2018 and December 2019, professional and business services led the year-over gain, adding 9,500 jobs and mostly driven by growth in professional, scientific, and technical services (up 7,500)

San Diego’s Quarterly Economic Snapshot: Q3 2019

Economic Snapshot header_11-2019

Summary

Every quarter San Diego Regional EDC analyzes key economic indicators that are important to understanding the regional economy and the region’s standing relative to the 25 most populous metropolitan areas in the U.S. This issue covers data from Q3 2019.

Over half of the 24 most populous metros experience a decline in total nonfarm employment during Q3 from Q2, including San Diego. The region saw a decline of 2,200 jobs – a 0.1 percent decrease in total nonfarm employment from Q2 to Q3, primarily due to seasonal changes. On the other hand, compared to a year ago, nonfarm employment was up 30,600, or 2.1 percent.

Key findings from the snapshot:

  • San Diego’s unemployment continues to drop, at 2.7 percent in Q3
  • While there was a decrease in nonfarm employment from Q2 to Q3 2019 due to seasonal changes, annual nonfarm employment was up 30,600 jobs, or 2.1 percent compared to Q3 2018
  • San Diego’s housing market was the third most expensive in the nation, despite home prices decreasing in Q3 both quarterly and annually
  • Housing permits increased substantially year-over-year in San Diego, largely due to multi-family housing permits increasing by nearly 133 percent
  • Overall, total housing permits increased nearly 68 percent compared to a year ago
  • San Diego saw 34 VC deals worth $707 million

Median Sales

Quarterly Economic Snapshot analyzes key economic indicators that are important to understanding the regional economy and the region’s standing relative to the 25 most populous metropolitan areas in the U.S. This releases includes data from July to September (Q3) 2019.

Read the full report

San Diego’s Economic Pulse: November 2019

Each month the California Employment Development Department (EDD) releases employment data for the prior month. This edition of San Diego’s Economic Pulse covers October 2019. Check out EDC’s research bureau for more data and stats about San Diego’s economy.

This report is sponsored by Manpower San Diego.

San Diego Economic Pulse – November 2019 from San Diego Regional EDC on Vimeo.

Highlights include:

  • The region’s unemployment rate was 2.8 percent in October, up from a revised 2.7 percent in September 2019, and below the year-ago estimate of 3.2 percent
  • The region’s unemployment rate remains lower than both the state and national unemployment rates of 3.7 percent and 3.3 percent, respectively
  • Between September 2019 and October 2019, total nonfarm employment increased from 1,516,200 to 1,525,000, adding 9,400 jobs
  • Between October 2018 and October 2019, total nonfarm employment increased from 1,495,400 to 1,525,600, adding 30,200 jobs
  • Between October 2018 and October 2019, government led the year-over gain, adding 8,200 jobs and mostly driven by growth in local government (up 5,100)

Future of Growth in San Diego: The Economic Case for Inclusion

Summary

The growth of San Diego’s innovation economy has made the region better educated and more prosperous than most other metros. However, this economic transformation presents new challenges for future growth. Changing skill requirements, a nationwide battle for talent, and a soaring cost of living are combining to form an unequivocal threat to our regional competitiveness. If unaddressed, San Diego will no longer be an attractive place to live and do business.

San Diego depends on a highly-educated workforce. However, talent shortages are likely to grow as demand for new skills accelerates and demographic gaps in educational attainment persist. The lack of quality jobs and a high cost of living further impact talent attraction and retention. For the region to remain competitive, an inclusive economic development strategy is needed. As part of San Diego’s Inclusive Growth Initiative, this research was produced by San Diego Regional EDC.

READ THE FULL REPORT

EDC research team composes Promise Zone Equitable Plan

SD Promise Zone

From December 2018 and January 2019, the San Diego Small Business Lending Collaborative surveyed 129 existing and 101 prospective business owners in three San Diego Promise Zone zip codes (92102, 92113 and 92114). The purpose of the survey was to identify barriers for small business establishment and growth within the San Diego Promise Zone, a geographic area comprising of Barrio Logan, Southeastern San Diego, and Encanto. Historically disadvantaged, the culturally rich communities within the San Diego Promise Zone possess unique barriers that inhibit economic growth.

The study, written by the San Diego Regional EDC, found that the biggest challenge business owners face is related to credit/financing. Only 12 percent of business owners have ever applied for business financing, and out of those who have, they found only expensive options or were declined due to bad credit or income requirements. The final report outlines recommendations and strategies for small business owners in the San Diego Promise Zone to overcome these obstacles and grow their companies. For example, expanding access to entrepreneurship training and accelerator programs for low to moderate income populations.

READ THE FULL REPORT HERE

Study: Addressing San Diego’s Affordability Crisis

Summary

In an effort to address San Diego’s soaring cost of living, San Diego Regional EDC and its Inclusive Growth Steering Committee of 40 employers officially endorsed a regional goal to create 75,000 newly thriving households by 2030. Driven by the findings in EDC’s latest study release, this regional goal and accompanying set of recommendations aim to address key factors (housing, transportation and childcare) impacting San Diego’s affordability crisis – the last of three main goals of a regional Inclusive Growth agenda.

View the full web report